
How to Look Up Anne Arundel County Jail Population Data
Jail population numbers do not all sit on one screen. They live across a few official and public sources, each with a different scope and update pace. The county runs the daily operation of its two detention sites through the Department of Detention Facilities. State and national bodies then roll county jails into broader counts. To read the data well, you need to know which source holds which figure.
The county side starts with the Department of Detention Facilities page and the county open-data portal. The portal carries operational metrics by department. The national side comes from the Bureau of Justice Statistics, which surveys jails across the country, and from the Vera Institute Incarceration Trends tool, which maps county-level counts year by year.
Each source updates on its own clock. County operational dashboards can refresh on a regular cycle. BJS jail surveys come out on a national release schedule, so the latest published year often trails the present by a year or two. Vera builds long trend lines from those federal datasets. Read a county snapshot for the current day, and read BJS or Vera for the longer arc.
The county OpenPerformance dashboard is the cleanest entry point for operational metrics.
You can open the Anne Arundel County OpenPerformance detention dashboard to view department performance measures for the detention facilities.
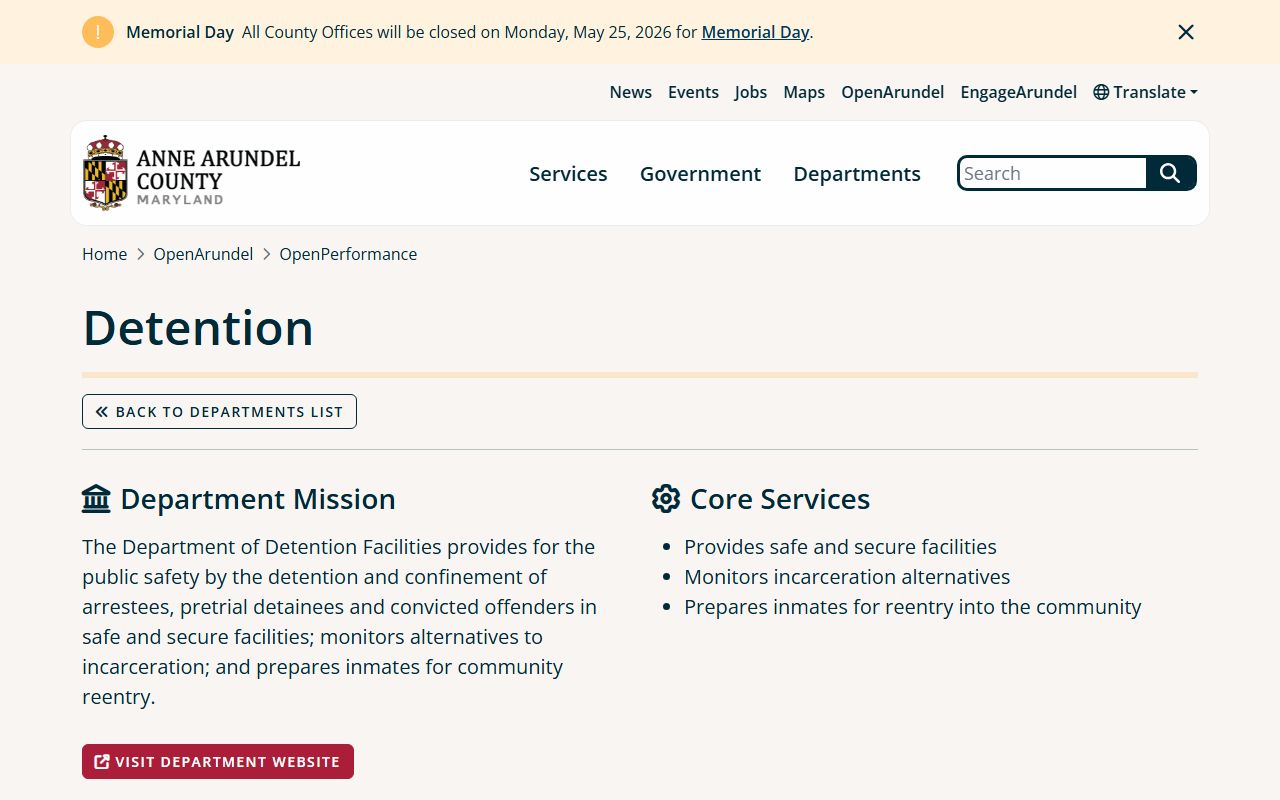
The dashboard groups detention metrics under the department view, so you can see what the county chooses to publish and how recent the figures are. When a number you want is not on the public dashboard, the next step is a direct request to the department or a check of the county budget books.
Anne Arundel County Jail Capacity Overview
The county holds inmates in two facilities, and each plays a different role. Jennifer Road Detention Center in Annapolis is the intake and pretrial site. Ordnance Road Correctional Center in Glen Burnie is the sentenced and programming site. Capacity is the count of beds a facility is rated to hold, and it sets the ceiling against which population is measured.
Here is the catch. The official facility pages do not publish a rated capacity number for either site. The county also does not post a current daily count on those same pages. That is a real data gap, not a fault on your end. The table below lists what is known and marks each capacity figure as not published rather than guessing at one.
| Facility | City | Rated Capacity | Population Role |
|---|---|---|---|
| Jennifer Road Detention Center | Annapolis | Not published on official facility pages | Intake and pretrial detention; Behavioral Observation Unit |
| Ordnance Road Correctional Center | Glen Burnie | Not published on official facility pages | Sentenced inmates; programming and reentry |
To get a firm capacity number, ask the Department of Detention Facilities directly, or pull it from a county budget document or a BJS facility census. The main detention contact line is 410-222-7374. For people held now, the live Anne Arundel County inmate records locator shows current housing and bail by person.
Note: Because rated capacity is not posted online, treat any capacity utilization figure you see elsewhere as unofficial until the department or a budget book confirms it.
Average Daily Population in Anne Arundel County
Average daily population, often shortened to ADP, is the mean number of people held across a set period. It smooths out the day-to-day swings that come from new bookings and releases. A jail can book and free dozens of people in a single day, so a single snapshot can mislead. ADP gives a steadier read of how full a system runs.
The official Anne Arundel County facility pages do not expose an ADP table. This is one of the gaps the research turned up. The county tracks operational counts behind the scenes, and some of that may surface on the OpenPerformance dashboard, but a clean published ADP series for Jennifer Road and Ordnance Road was not found on the public facility pages.
When a county figure is missing, two paths fill the gap. The county budget process reports detention workload measures year to year. The Bureau of Justice Statistics also collects average daily jail population through its national jail surveys. Both can put a number on the county count, though each lags the present and uses its own method.
Demographic Breakdown
A full demographic breakdown sorts the jail population by race, sex, and age. It shows who is held, not just how many. These splits drive a lot of policy work and a lot of public study, because they can reveal where a system treats groups in different ways.
For Anne Arundel County, the official facility pages do not publish a race, sex, or age breakdown of the jail population. The research did not locate a county demographic table on those pages. So the honest answer is that a county-level breakdown is not posted in one public spot, and you should not trust a figure that claims otherwise without a source behind it.
Two routes give demographic context. The Vera Institute Incarceration Trends tool reports county jail counts with race and sex splits built from federal data. The Bureau of Justice Statistics publishes national and state demographic profiles of jail and prison populations. Both let you frame the county within a wider pattern.
Note: Demographic figures from Vera and BJS reflect their survey years and methods, so confirm the current county mix with the Department of Detention Facilities before you cite a precise share.
Pretrial and Sentenced Population in Anne Arundel County
The biggest split in any county jail is pretrial versus sentenced. Pretrial means a person waits for a case to resolve and has not been convicted. Sentenced means a court has imposed a term and the person serves it. The two groups have different rights, different programs, and different lengths of stay.
In Anne Arundel County, the two facilities map onto this split fairly cleanly. Jennifer Road mostly holds the pretrial population, with limited programming such as self-help groups and short workshops. Ordnance Road runs a fuller program menu for sentenced inmates, plus reentry support. The table sets the split side by side.
| Group | Primary Facility | What It Means |
|---|---|---|
| Pretrial | Jennifer Road Detention Center | Held while a case is open; not yet convicted; limited programming |
| Sentenced | Ordnance Road Correctional Center | Serving a court-ordered term; fuller program menu and reentry support |
An exact pretrial-to-sentenced ratio for the county was not found on the official pages. National data is clear that pretrial holds make up a large share of county jail counts, and BJS reports on that share each survey cycle. For a current local ratio, the Department of Detention Facilities or the county budget books are the place to ask.
Mental Health and Medical Population in Anne Arundel County
Jails hold many people with health and mental health needs, so screening starts at the door. In Anne Arundel County, a nurse runs a medical screen and a mental health screen within four hours of arrival. A fuller physical exam, including tuberculosis and STD testing, follows within 14 days. These steps catch urgent needs early.
Jennifer Road runs a Behavioral Observation Unit for inmates with mental health needs. The unit works as a therapeutic community, with the goal of stabilizing inmates so they can return to general housing or to the community. That makes it a distinct slice of the population, even though the county does not publish a head count for the unit on its public pages.
Clinical case managers help inmates with mental illness line up continuing care for after release. The size of the medical and mental health population is not posted as a public figure. To understand the share, BJS national jail studies on mental health needs offer the closest published context.
National and State Context
County numbers mean more when you set them next to state and national rates. The standard measure is the jail or prison count per 100,000 residents. That rate lets you compare a small county to a large one on fair footing. The Bureau of Justice Statistics is the main keeper of these national and state figures.
The comparison block below frames how the three levels stack up. The county figure should be confirmed from the OpenPerformance dashboard or the county budget, since an exact current county rate per 100,000 was not found on the official facility pages. The state and national entries point to where the published rates live. The cells avoid invented precise rates on purpose.
| Level | Rate per 100,000 | Where to Confirm |
|---|---|---|
| Anne Arundel County (county) | Confirm from county dashboard or budget | OpenPerformance detention dashboard; Department of Detention Facilities |
| Maryland (state) | See published BJS state figure | Bureau of Justice Statistics state tables |
| United States (national) | See published BJS national figure | Bureau of Justice Statistics national reports |
The Bureau of Justice Statistics publishes the state and national jail and prison rates, and the Vera Institute charts the county rate against state and national lines over time. Use BJS for the official rate and Vera for the visual trend. Always check which year a rate reflects before you compare it to today.
Note: The county, state, and national rows above are clearly labeled, and the precise per-100,000 values must be pulled from the cited sources rather than assumed.
Anne Arundel County Jail Population Trends Over Time
A single count is a snapshot. A trend line is the story. Trends show whether a jail population is rising, falling, or holding steady across years, and they tie those moves to bail reform, charging shifts, court backlogs, and local policy. Anne Arundel County did not post a five-year ADP or utilization table on the official pages reviewed.
That gap is where outside trend tools earn their keep. The Vera Institute Incarceration Trends tool is built for exactly this. It maps county jail and prison counts year by year, so you can see the long arc for Anne Arundel County against the state and the nation. The figures come from federal datasets, so they trail the present but cover many years.
For an official trend, two county sources help. The OpenPerformance detention dashboard may carry period-over-period metrics. The county budget reports detention workload measures across fiscal years. Pair those county sources with Vera and BJS for a fuller view.
The detention department homepage is the anchor for these official sources.
You can start at the Department of Detention Facilities homepage for the county detention overview and contacts.
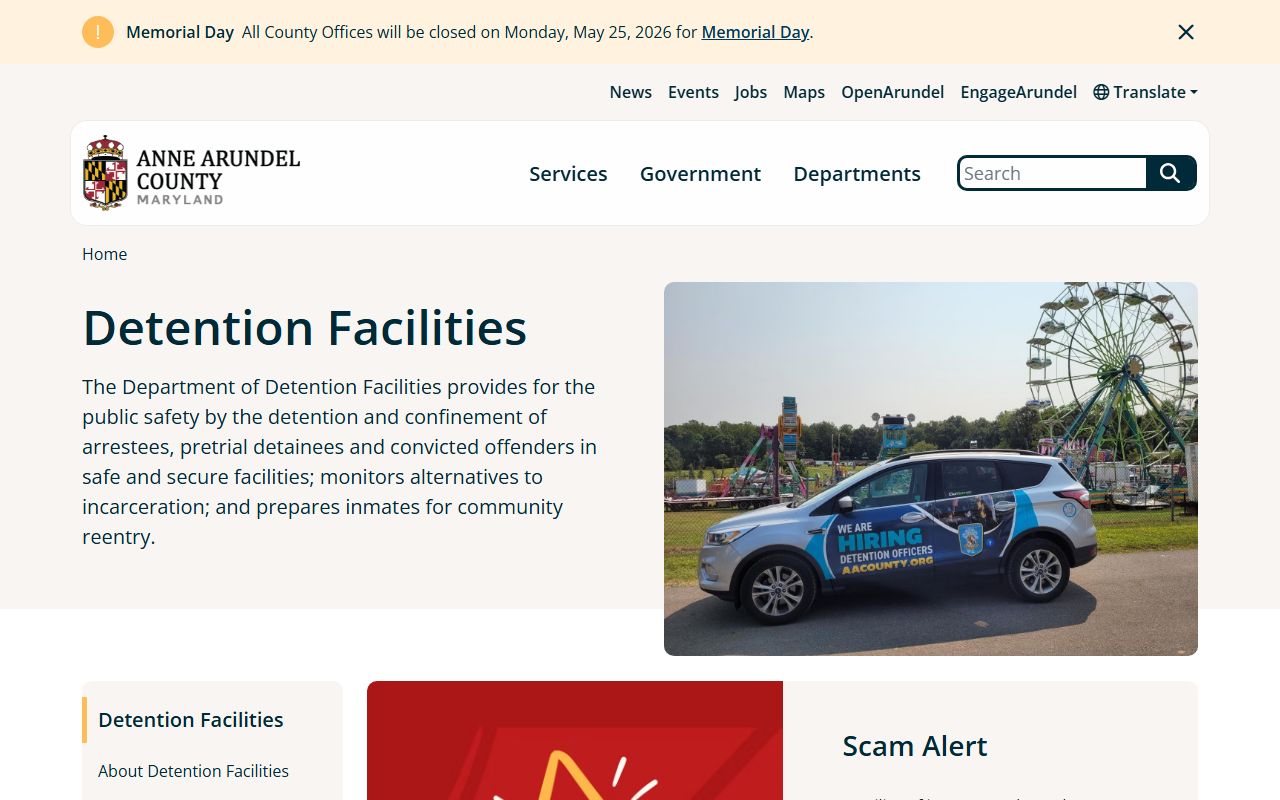
From that homepage you reach facility details, the inmate locator, and the contact line for population questions the public pages do not answer. It is the right first stop when a trend figure is not posted online.
Searching for Anne Arundel County Inmate Records by Name
Population data counts people in bulk and does not name them. To find one person, where they are housed, their bail, and their court dates, use the live locator on the Anne Arundel County inmate records page, which searches by first and last name or by JID rather than by aggregate count.
Where the Data Comes From
It helps to know who produces each figure. County operations come from the Department of Detention Facilities. National and state surveys come from the Bureau of Justice Statistics. County-level trend lines come from the Vera Institute, which builds on the federal data. Each fills a role the others do not.
The list sets out the main sources and what each one holds.
- Department of Detention Facilities - county facility roles, intake process, and the inmate locator.
- OpenPerformance dashboard - county detention operational metrics by department.
- Bureau of Justice Statistics - national and state jail and prison counts and rates.
- Vera Institute Incarceration Trends - county-level trend lines over many years.
- County budget documents - detention workload measures by fiscal year.
For names and live custody status, the inmate records locator is the tool, and the released inmates page covers release verification and notifications. If a case behind a booking matters, the arrest records and warrant records pages explain how charges and warrants are searched. Population data and individual lookups answer different questions, so use the source built for the question you have.